Stop database problems before they reach production.
DBGorilla watches every query, catches performance regressions and cost leaks, then tests the fix on an isolated clone, so your team sees proof before anything changes.
No card. Connects out, so your credentials stay in your network.
3.8s → 40ms
A single index DBGorilla suggested and tested on a clone can make all the difference.
30%
Execution cost cut on one customer's worst query, inside 24 hours
340%
Latency rise caught six days before anyone was paged
Free
Start free, no card. $105/mo when you scale: whole team, no per-seat fees.
Three commands
$brew install dbgorilla/tap/dbgorilla
$dbgorilla login
$dbgorilla collector install
What early customers are telling us
"I just ran a benchmarked query with the indexes applied and 🤯 157x faster."
CTO, no-code application platform
"Using the config feedback from DBGorilla sped up one of our workflows by 30%, from 12 hours down to 8."
Senior Consultant, real estate data platform
"In the first few hours, DBGorilla delivered the visibility I needed, a breakthrough I had not been able to achieve before."
CTO, large financial company
"DBGorilla helped us immediately gain visibility into our PL/pgSQL functions for the first time, making it easier to identify issues and understand our databases."
Founder, security services startup
The same six days
One query gets slower. DBGorilla catches, optimizes and reports back before it pages someone.
Without DBGorilla
Found by a pageday 0 · plan flipssilenceday 6 · paged
- A query gets slower over weeks and nobody notices until it pages someone.
- The investigation starts at a dashboard and ends at a guess.
- The fix is tested in production, because there is nowhere else to test it.
- What you learned lives in one engineer's head.
production is the test environment
With DBGorilla
Found by the agentday 0 · caughtthe six days never happen
- The regression is found the night it starts, with the cause attached.
- The investigation arrives finished: symptom, cause, evidence.
- The fix is benchmarked before it reaches you.
- What it learns about your database stays with the database.
Clone lane · the fix is measured here first
3.8s→40msone index · verified on a production-shaped clone
Everything it does. Pick the part you were sent here for.
Query optimization
Find the query costing you money
Plans read, root cause identified, and the exact index or rewrite recommended, with the before and after measured on a clone.
See it on /solutions →query · plan
validated on a cloneSELECT o.id, c.name FROM orders o JOIN customers c ON c.id = o.customer_id WHERE o.created_at > now() - interval '7 days'; - Seq Scan on orders (rows=4,100,000) + Index Scan using idx_orders_created_at
- Query time
3.8s→ 40ms- Rows scanned
4.1M→ 2,140- Lock contention
- none
Regression detection
Catch it the night it starts
Continuous watch over queries, schema and configuration, so a plan that flipped three deploys ago is explained before it pages anyone.
See it on /solutions →overnight · 02:14
delivered to SlackRegression detected on the orders table Symptom Query latency up 340%, rising for 6 days Cause Missing index on (tenant_id, created_at) after last week's migration Related Autovacuum behind · dead tuples at 22% Next Composite index, benchmarked and ready
- Found at
- 02:14
- You read it
- 08:30
Proof before production
Nothing reaches you unproven
Every fix, index and migration is validated on a production-shaped clone before it is recommended, so you review measured evidence instead of a plausible answer. Nothing to clean up afterwards.
See it on /solutions →validation · clone
before it was recommendedProposed composite index on (tenant_id, created_at)
✓ applied to a production-shaped clone
✓ measured against the real query
✓ row counts match production
✓ no lock held longer than 50ms
Verdict safe to apply- Query time
3.8s→ 40ms- Evidence
- measured, not predicted
Schema & health
See the whole estate
Schema diagrams, health indicators and history you can question, across every connected instance.
See it on /solutions →schema · orders
3 instances connected- Dead tuples
- 22%
- Autovacuum
- behind
- Indexes
- 1 missing
AI-DBA chat
Ask it anything about your database
It knows your schemas, your workloads and your past incidents, so the answer is about your database and not about Postgres in general.
See it on /solutions →ai-dba · chat
knows your schemaWhy did the orders page get slow this week?
Last week's migration dropped the composite index on (tenant_id, created_at), so that query went to a sequential scan over 4.1M rows. I have the replacement benchmarked on a clone.
- Context
- your database
- Not
- Postgres in general
In your IDE
It shows up where you already work
MCP in any IDE or AI app, and one command wires up every client it detects. Ask about a query where you are writing it, not in another tab.
See it on /solutions →terminal
one command$ dbgorilla setup-ide ✓ Claude Code ✓ Cursor ✓ VS Code Ready ask about a query where you write it
- Protocol
- MCP
- Clients
- any that speaks it
In your channels
And where your team already talks
Findings arrive in Slack or Teams, incidents reach your on-call through a webhook into whatever you already page with, and the API and CLI are there when you would rather script it than click it.
See it on /solutions →#db-alerts
02:14Regression detected on the orders table. Latency up 340% over six days. Cause: missing index on (tenant_id, created_at). Fix benchmarked and ready.
- Chat
- Slack · Teams
- On-call
- webhook
- Scripted
- API · CLI
Query Optimization
We find the thing costing you money
DBGorilla analyzes your query plans, identifies the root cause of slowdowns, and recommends the exact index or rewrite needed, with no manual digging required
measured3.8s→40ms
query · plan
validated on a cloneSELECT o.id, c.name FROM orders o JOIN customers c ON c.id = o.customer_id WHERE o.created_at > now() - interval '7 days'; - Seq Scan on orders (rows=4,100,000) + Index Scan using idx_orders_created_at
- Query time
3.8s→ 40ms- Rows scanned
4.1M→ 2,140- Lock contention
- none
Analyzer
We tell you what happened while you slept
Historical trend tracking: Find out what happened last night, last week or last month with one question
340% latency rise · caught six days early
overnight · 02:14
delivered to SlackRegression detected on the orders table Symptom Query latency up 340%, rising for 6 days Cause Missing index on (tenant_id, created_at) after last week's migration Related Autovacuum behind · dead tuples at 22% Next Composite index, benchmarked and ready
- Found at
- 02:14
- You read it
- 08:30
Proof before production
The agent proves it before you ever see it
Every recommendation is run on a production-shaped clone first, and the before and after are measured. So what reaches you is evidence, not a confident guess, which is the failure mode of every other AI that writes SQL.
validation · clone
before it was recommendedProposed composite index on (tenant_id, created_at)
✓ applied to a production-shaped clone
✓ measured against the real query
✓ row counts match production
✓ no lock held longer than 50ms
Verdict safe to apply- Query time
3.8s→ 40ms- Evidence
- measured, not predicted
Runs where your database already runs. Including nowhere near us.
The SaaS is a collector install
There is no agent to embed and no database to hand over. You run `dbgorilla collector install`, it connects out to DBGorilla, and your credentials never leave your network.
Or run the whole thing yourself
Fully self-managed, in your own VPC or air-gapped, where data never leaves your network.
It fits the governance you already have
SSO, RBAC and ticketing integration, so access follows the rules you already wrote.
Any Postgres speaking the native protocol. These are examples, not an allowlist
- Amazon RDS
- Amazon Aurora
- Neon
- Instaclustr
- Google Cloud SQL
- Azure Database for PostgreSQL
- Supabase
- Self-managed
- Bare metal
- EKS · GKE · AKS
- Rancher
- Private cloud
Where your data goes, and where it does not
The shape of your database crosses the line. The contents stay put.
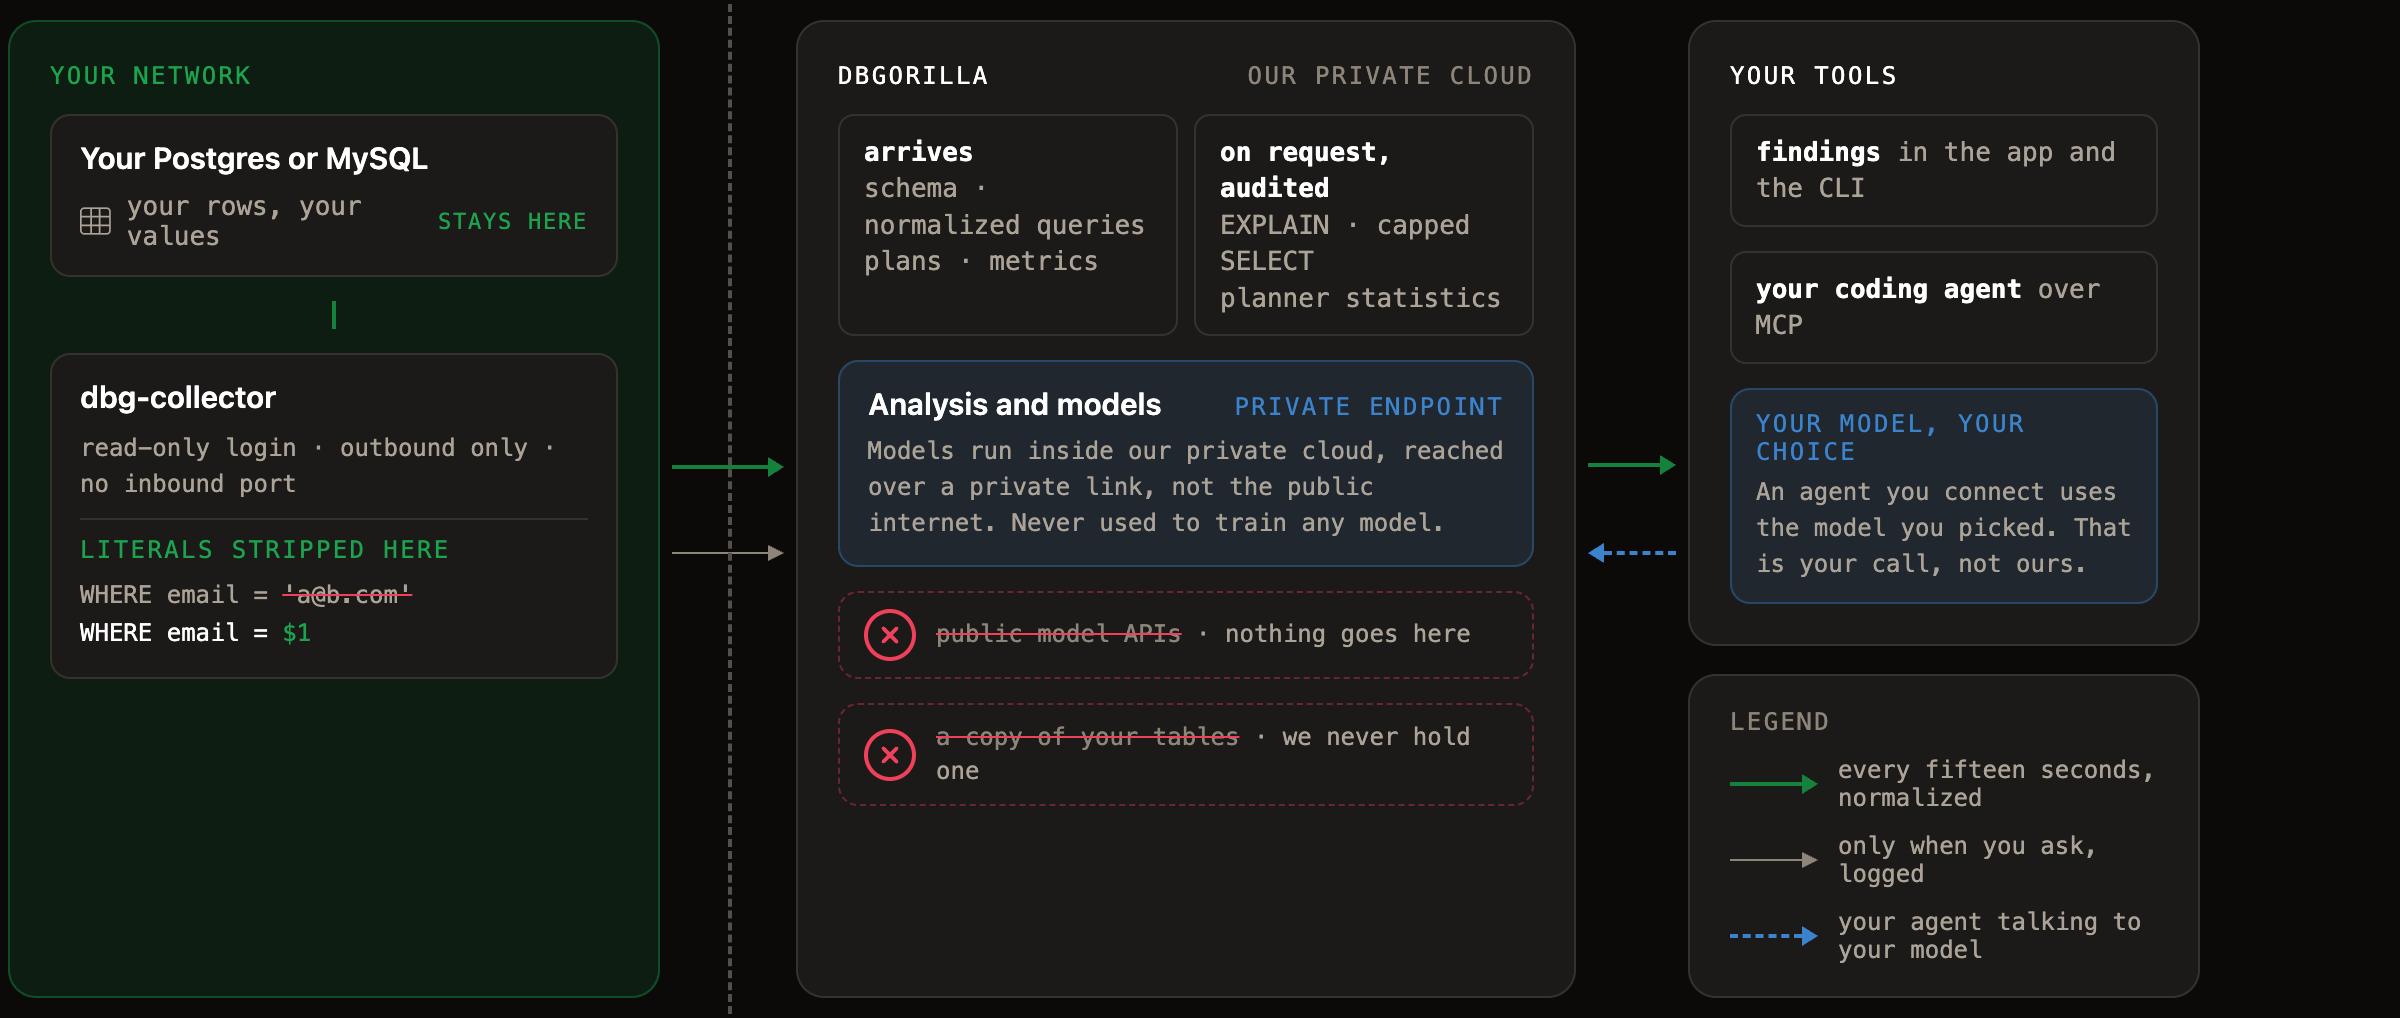
Your rows never leave unless you ask for them: audited, capped, off by default. Your queries are normalized before we see them. Models run in our private cloud and are never trained on your data. We never hold a copy of your tables.
Hosted by us
The collector runs inside your network with a read-only login and only ever connects outward. It strips the literals out of every query before anything is sent, so what crosses the line is the shape of your database: schema, normalized queries, plans and metrics. Analysis runs on models inside our private cloud, over a private link. Nothing goes to a public model API, and nothing is used to train one.
On-prem and air-gapped
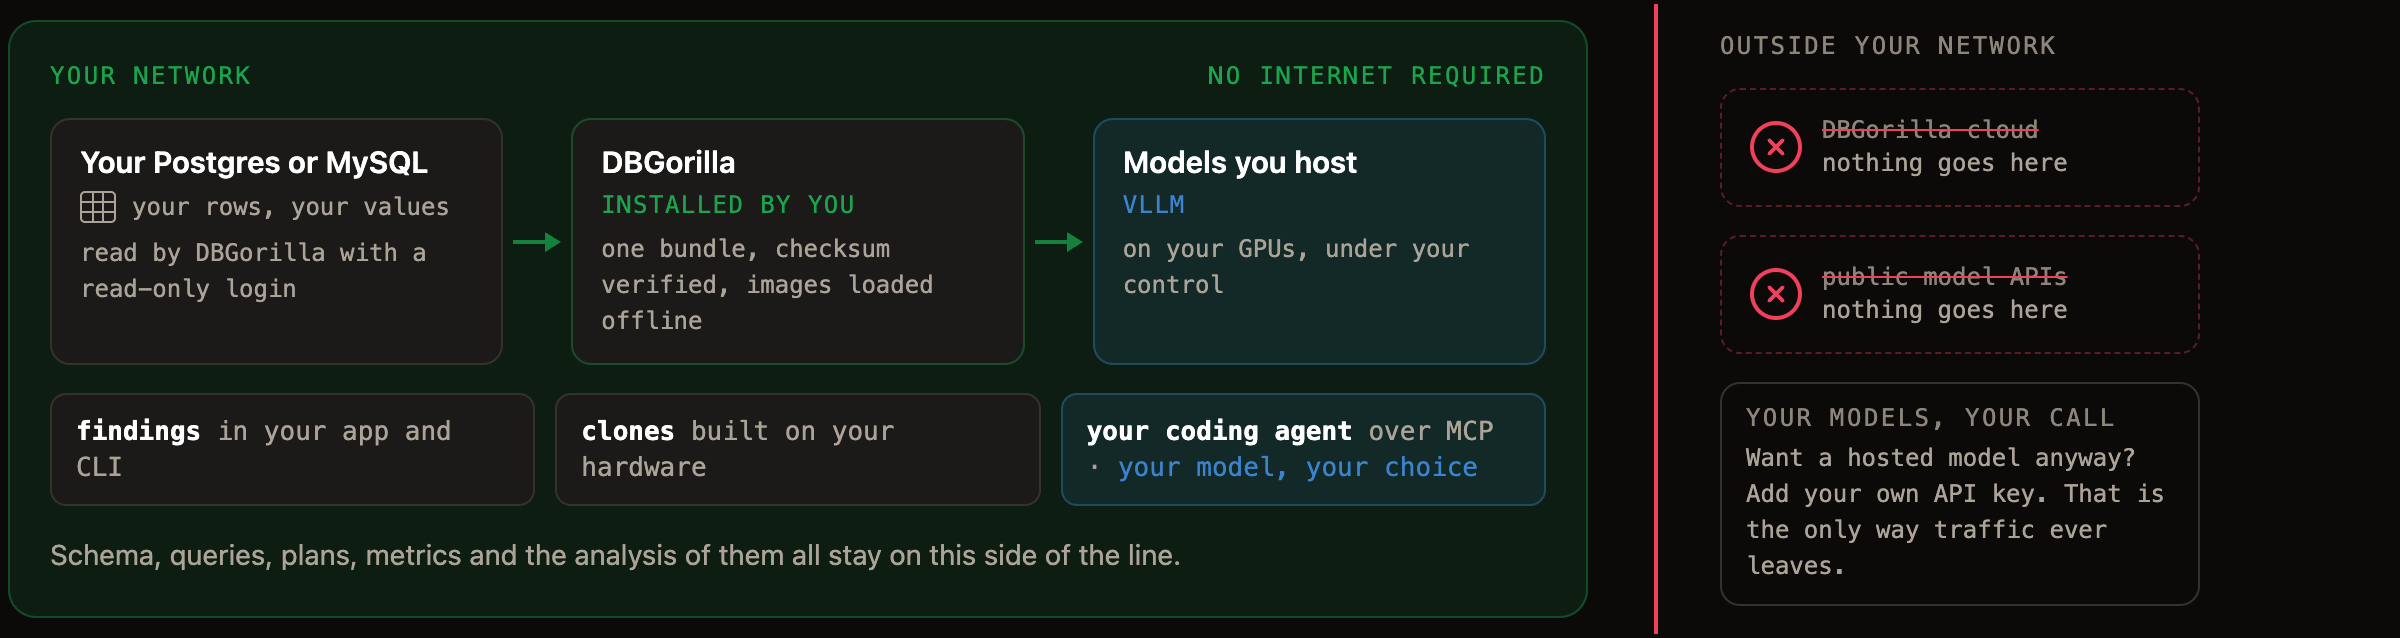
The database, DBGorilla and the models all run on your hardware. DBGorilla opens no connection out, so nothing crosses your perimeter because of it: not your data, and not what it learns from your data. If you want a hosted model anyway, that is your key and your choice.
Deploy anywhere
DBGorilla can run fully-hosted in our cloud, in your own VPC, or fully self-managed in air-gapped environments where data never leaves your network, so our Agentic Database Operator adapts to your strictest security and compliance needs
Fits your IT governance
Seamlessly integrate via SSO, RBAC, and ticketing systems for IT governance
And the rest of it
- Schema diagramsTransform complex database architectures into clear, interactive diagrams
- Query visualizationDemystify your query execution with interactive, AI-driven visualizations
- AutomationStreamline your database management with intelligent automation
- AI-DBA chatChat with your expert AI-DBA about any task. It knows more about your databases than you do
Three commands, and it starts watching tonight
$105/mo for three clusters and the whole team. No per-seat fees.